Lewotobi Eruption Response Dashboard
Developed a 4-page Power BI dashboard during my Data Analyst internship at Human Initiative to monitor disaster response operations for 299 households following the 2025 Lewotobi eruption.
Overview
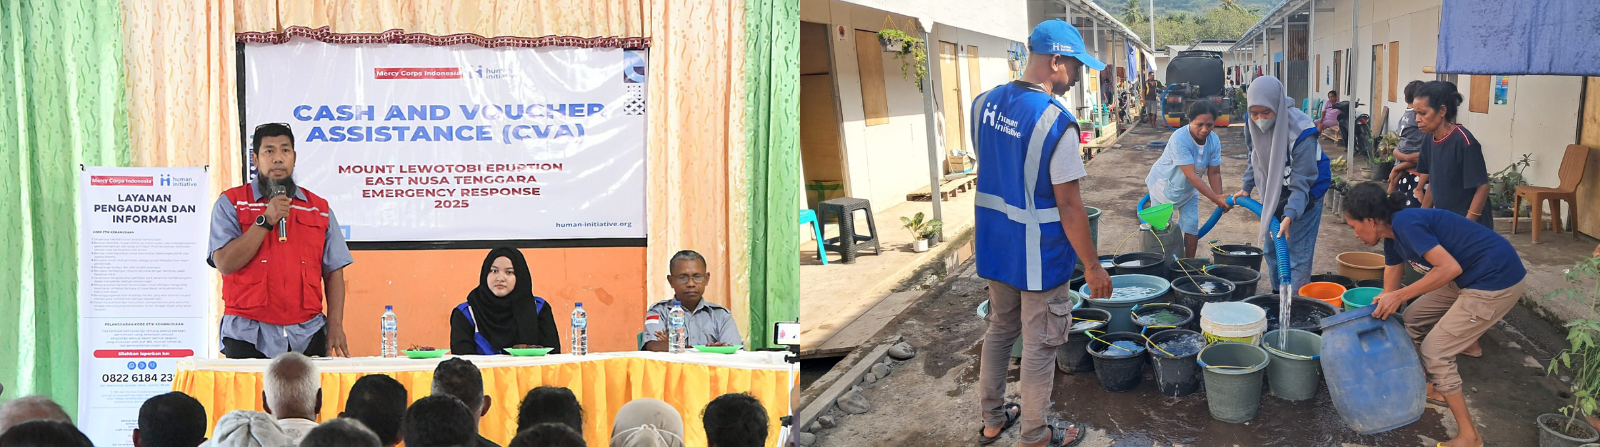
Following the November 2025 eruption of the Lewotobi Laki-Laki volcano in East Flores, Human Initiative launched emergency response programs to support displaced communities. Two critical interventions deployed were Cash & Voucher Assistance (CVA) and Water, Sanitation & Hygiene (WASH).
During my Data Analyst internship at Human Initiative, I designed and built a monitoring dashboard to track beneficiary demographics and evaluate program efficacy based on direct community feedback across three sub-districts (Ilebura, Titehena, and Wulanggitang).
Data Architecture & ETL Pipeline
Field data was collected via surveys across displacement sites and delivered as raw Excel files. The data structure presented significant challenges, primarily involving multi-select survey responses stored in single columns and inconsistent manual text entries.
Before visualization, the data required an extensive ETL pipeline built entirely within Power Query in Power BI Desktop.
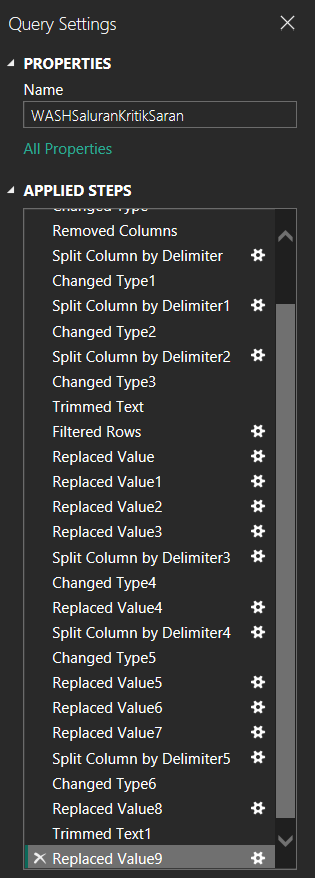 Power Query applied steps for the WASH feedback table. The pipeline handles multi-select survey responses and standardizes raw field data.
The transformation process included:
- Delimiter Splitting to separate multi-select answers into individual countable rows.
- Value Replacement to standardize inconsistent terminology from different field officers.
- Data Type Enforcement to ensure accurate numeric aggregations and date filtering.
Executing these steps in Power Query established a repeatable pipeline, allowing the dashboard to update automatically when Human Initiative’s field teams provide new monthly data files.
Data Modeling
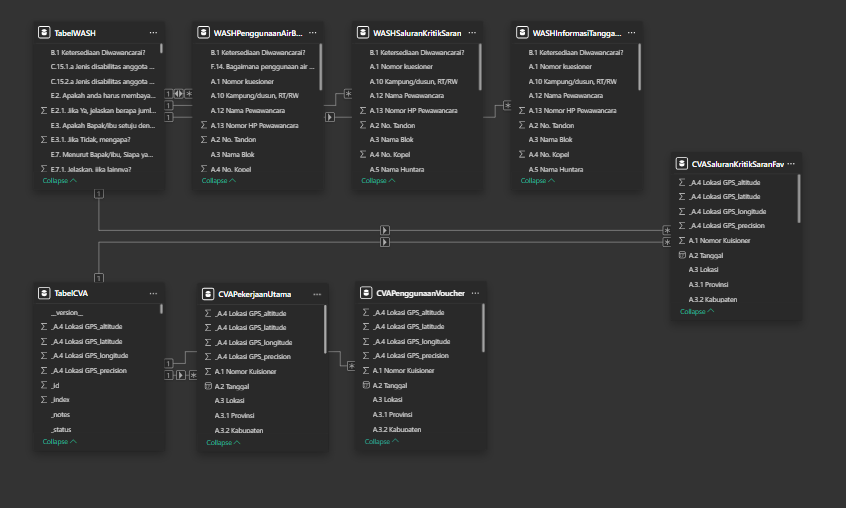 The relational data model. Multi-select survey responses were unpivoted into separate related tables to maintain data integrity and prevent double-counting.
Following the ETL process, a relational data model was established to handle the complex survey structure.
The model relies on two primary tables (TabelWASH and TabelCVA) which contain the core demographic data at the household grain, meaning one row represents one respondent.
To accurately analyze multi-select questions such as water usage, preferred feedback channels, and voucher spending, I created separate sub-tables. These are linked to their respective primary tables via a 1-to-many (1:*) relationship using the unique identifier Nomor Kuesioner.
Dashboard Structure
The report is structured into a 2×2 matrix comprising four distinct pages to separate the programs and view types. Cross-page navigation buttons allow response coordinators to seamlessly switch contexts during operational briefings.
| Demographics | Feedback | |
|---|---|---|
| PDM WASH | Page 1 | Page 2 |
| PDM CVA | Page 3 | Page 4 |
WASH Program Analysis
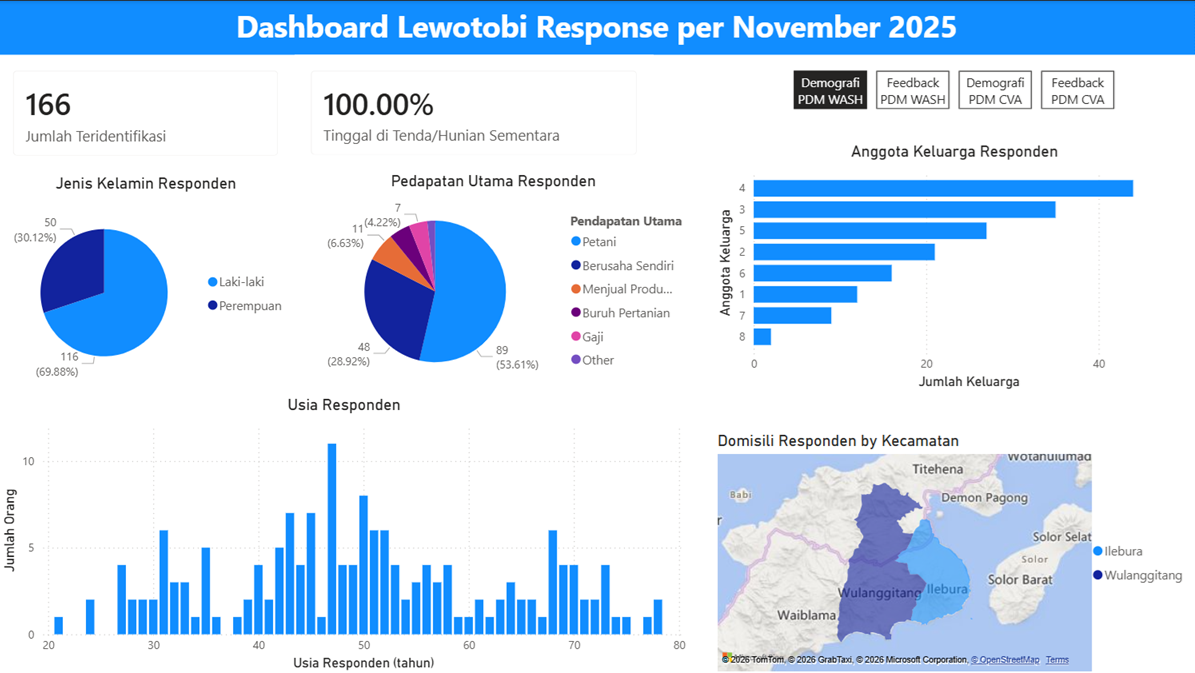 WASH Demographics page detailing 166 beneficiaries residing in temporary shelters.
The WASH program data captured 166 beneficiaries heavily concentrated in the Ilebura and Wulanggitang sub-districts. The demographic profile shows a population highly vulnerable to displacement impacts. Female-headed households make up nearly 70% of the respondents, and the primary income source for the majority is agriculture, which was severely disrupted by the eruption.
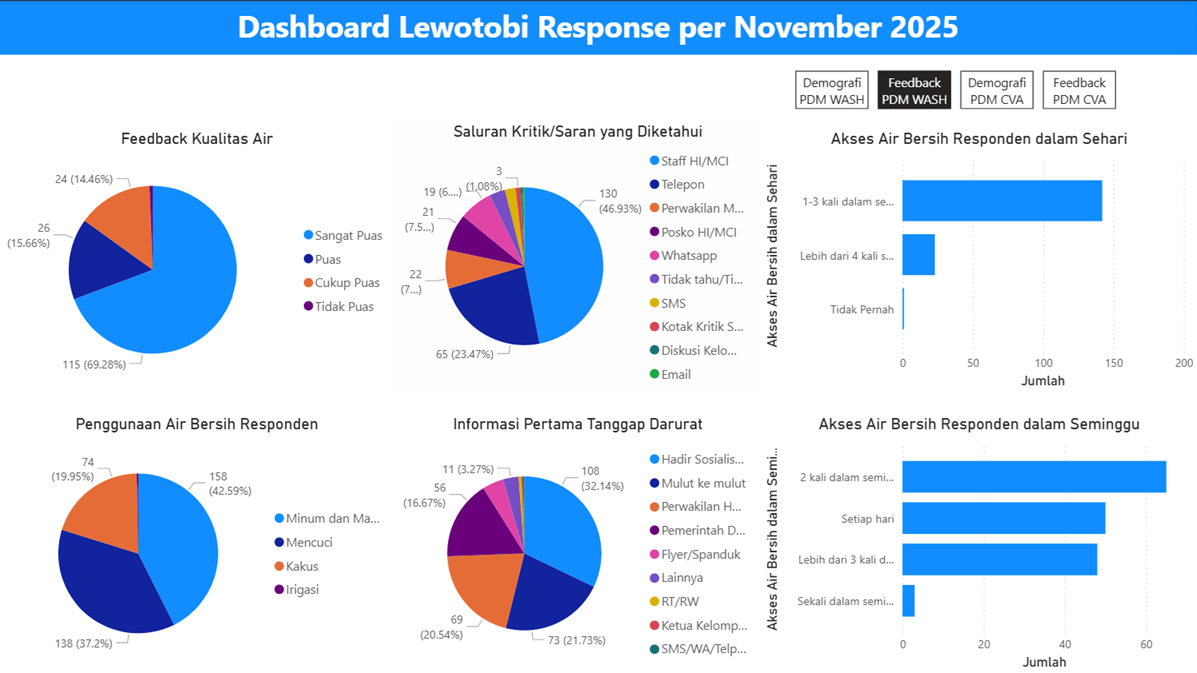 WASH Feedback page tracking water quality satisfaction and access frequency.
From a performance standpoint, nearly 70% of beneficiaries reported being very satisfied with water quality. The primary use for this water is drinking and cooking. However, the access frequency data revealed operational gaps. While most access clean water multiple times a day, a specific subset reported inconsistent daily access. Furthermore, beneficiaries indicated that their preferred method for submitting feedback or complaints is through direct communication with Human Initiative staff rather than digital channels.
CVA Program Analysis
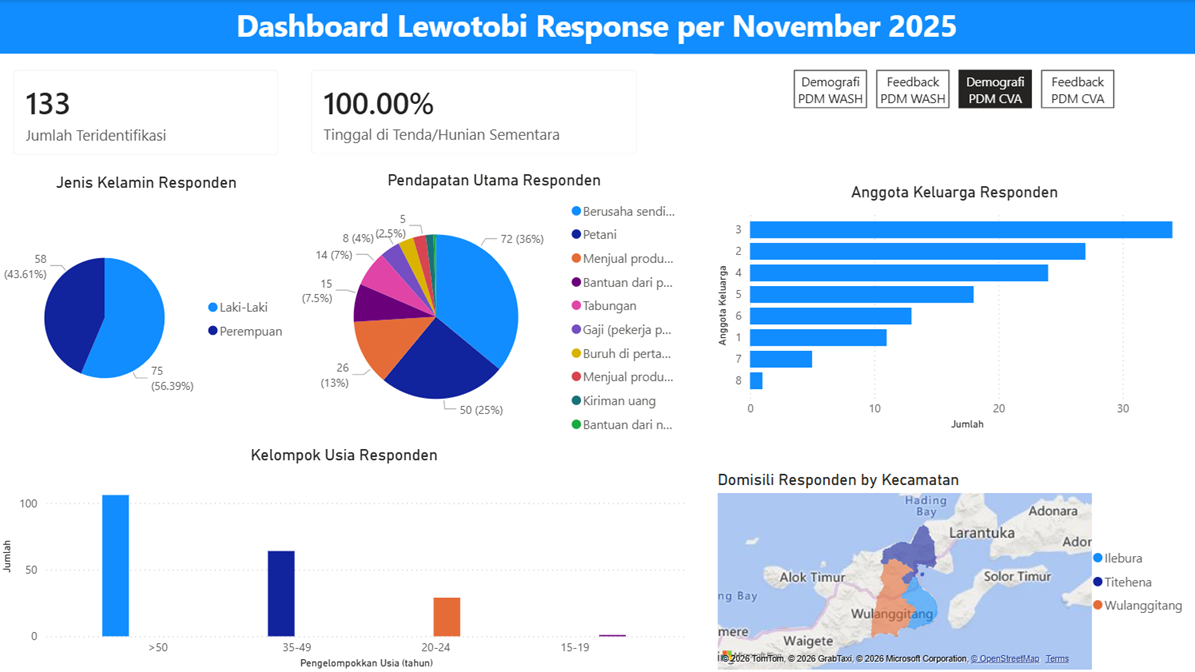 CVA Demographics page tracking 133 beneficiaries across three sub-districts.
The CVA program reached 133 beneficiaries with a slightly different demographic makeup. While still majority female, the gender gap is narrower. The recipients are generally older (predominantly over 50) and have a more diverse livelihood profile, with self-employment being the most common income source.
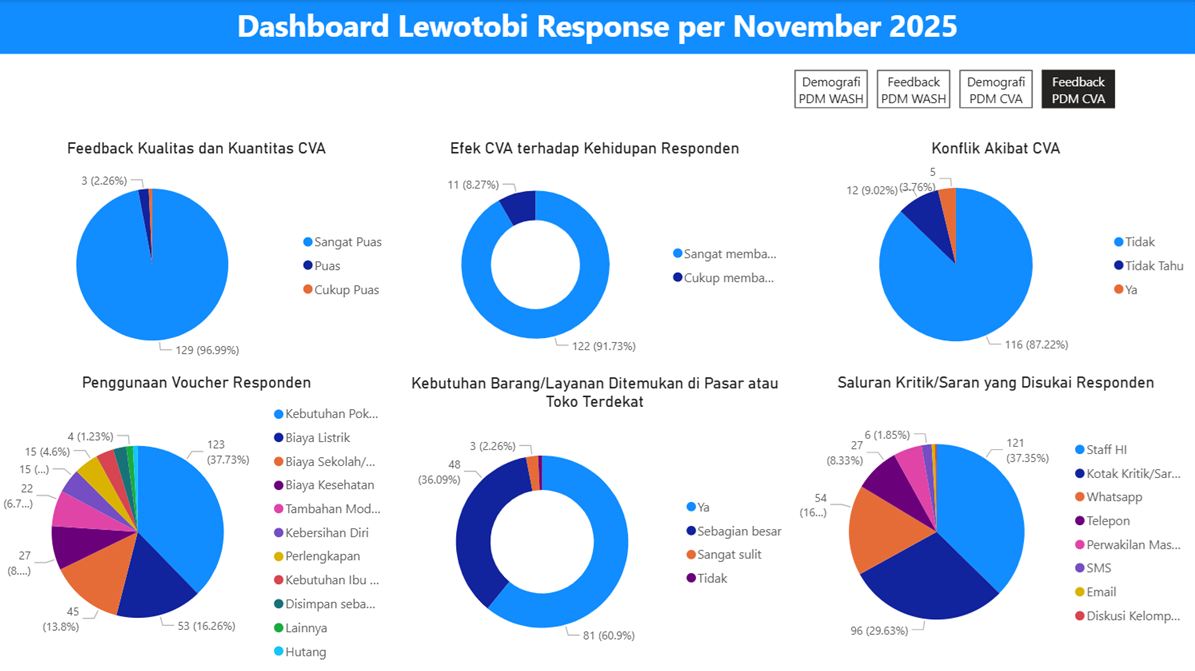 CVA Feedback page monitoring voucher usage and market availability
Key Strategic Insights
Integrating the findings from both programs provides several actionable takeaways for humanitarian coordinators:
- Accountability Risks: Both cohorts heavily rely on direct contact with Human Initiative field staff to provide feedback. While this indicates strong community trust, it creates a single point of failure for reporting systemic issues or grievances.
- Targeting Discrepancies: The demographic differences between the two programs (especially regarding gender and livelihood) suggest varied targeting criteria. This warrants a review to ensure equitable access to all forms of aid.
- Supply Chain Interventions: The success of the CVA program is somewhat bottlenecked by local market inventory. Future operational phases may need to include market-support interventions to ensure supply matches beneficiary purchasing power.
Technical Notes
- Tool: Power BI Desktop with Power Query for ETL
- Data source: Local Excel files from field survey data collection
- Navigation: Four-page report with cross-page navigation buttons styled to match program/view labels
- Map visual: Used Power BI’s built-in map visual with sub-district (kecamatan) as the geographic field
Tools & Skills Demonstrated
Power BI · Power Query · Excel · ETL / Data Cleaning · Humanitarian Data Analysis · Dashboard Design · Multi-select Survey Data Processing