Heart Disease Classification with Machine Learning
Evaluated 6 machine learning models to predict heart disease presence, achieving 76% accuracy through ensemble soft voting on clinical data.
This project was developed as an individual assignment for the Data Science & Artificial Intelligence course by Startup Campus.
Overview
Accurate prediction of heart disease is critical for early clinical intervention. However, medical datasets often present challenges such as class imbalance, noise, and high dimensionality.
The objective of this project was to build and compare multiple supervised classification models to predict the presence of heart disease. The analysis focuses on identifying the best-performing algorithm and balancing model complexity with generalization capability.
Dataset & Preprocessing
The dataset was sourced from Kaggle (Heart Disease Dataset), consisting of 1,025 patient records and 14 clinical attributes. The target variable is binary, indicating the presence or absence of heart disease.
To ensure data quality before modeling, several preprocessing steps were executed:
- Deduplication: Removed identical records, reducing the dataset to 1,012 rows.
- Outlier Treatment: Applied the Interquartile Range (IQR) method to cap extreme values in the resting blood pressure (
trestbps) and cholesterol (chol) features. - Balancing: Used Synthetic Minority Oversampling Technique (SMOTE) to correct the target variable imbalance, ensuring the models do not bias toward the majority class.
- Scaling: Normalized all numerical features using MinMaxScaler to standard
[0, 1]ranges, which is essential for distance-based algorithms.
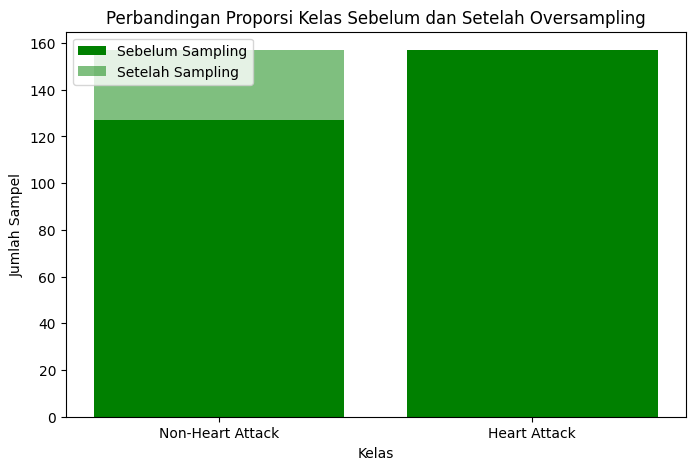 Figure 1: A bar chart showing the results before and after using SMOTE
Exploratory Data Analysis (EDA)
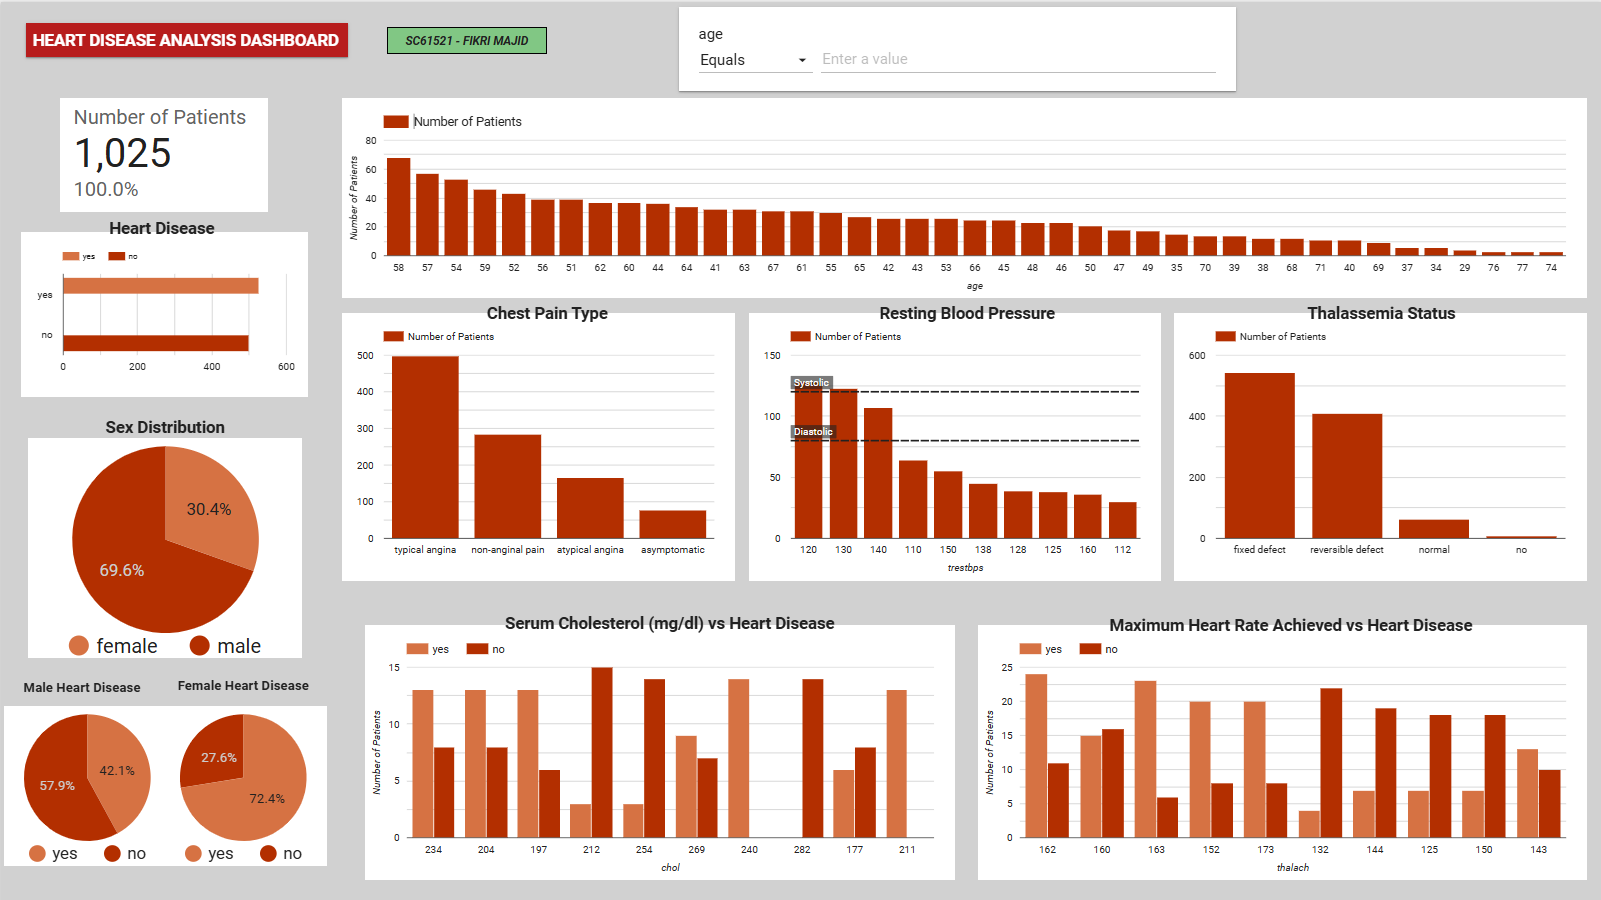
Before training the models, an interactive dashboard was developed to explore the clinical distributions and identify visual patterns between patient demographics and heart disease rates.
 Figure 2: Interactive EDA dashboard highlighting the relationship between key clinical metrics (e.g., max heart rate, chest pain type) and heart disease diagnosis.
Key insights from the visual exploration:
- Gender Disparity: The dataset contains significantly more male records (69.6%), but females in this specific dataset showed a higher proportional rate of heart disease diagnosis.
- Chest Pain (cp): Patients with ‘typical angina’ form the largest group, but variations in chest pain type strongly correlate with positive diagnoses.
- Max Heart Rate (thalach): Higher maximum heart rates visually cluster around positive heart disease cases, validating its later selection as a core predictive feature.
Feature Selection
A Pearson correlation analysis was conducted to identify the most relevant predictors and reduce dimensionality. Features with a correlation coefficient greater than 0.1 against the target variable were retained.
The final model inputs were:
- Chest pain type (
cp) - Maximum heart rate achieved (
thalach) - Slope of peak exercise ST segment (
slope) - Resting ECG results (
restecg)
Chest pain type and maximum heart rate exhibited the strongest positive correlation with the target, aligning with established clinical risk factors.
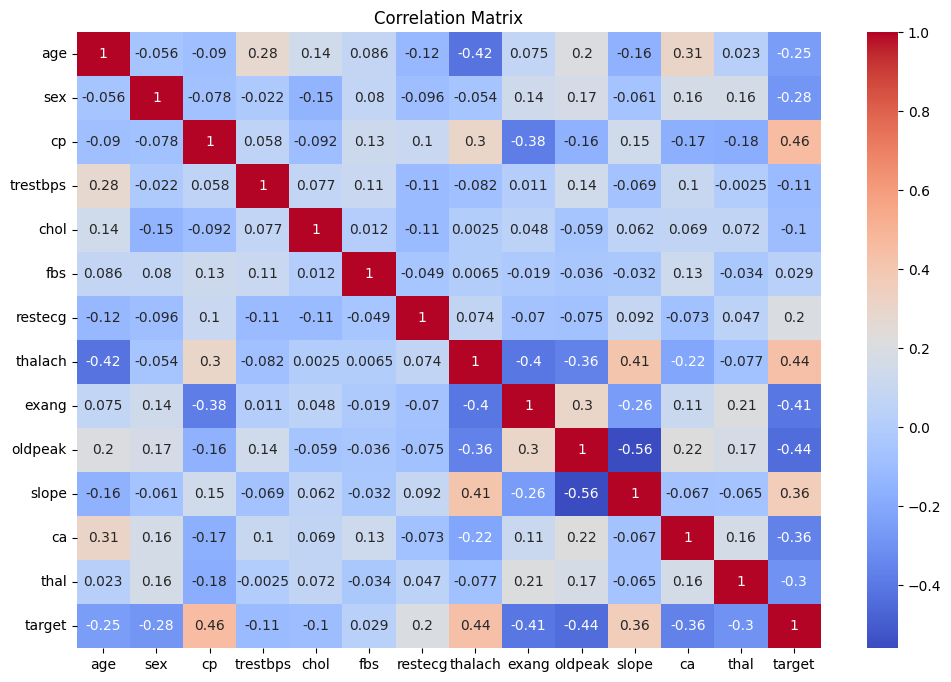 Figure 3: The heatmap shows the correlation between features
Model Evaluation & Tuning
Six classification algorithms were evaluated using an 80/20 train-test split: Logistic Regression, Decision Tree, K-Nearest Neighbors (KNN), Random Forest, Support Vector Machine (SVM), and XGBoost.
Initial learning curves indicated that Decision Tree and Random Forest suffered from high variance (overfitting), while KNN and XGBoost demonstrated better generalization as training data increased.
To optimize performance, hyperparameters for each model were tuned using GridSearchCV with 5-fold cross-validation. Post-optimization results showed that Logistic Regression and XGBoost achieved the highest Area Under the Curve (AUC) scores.
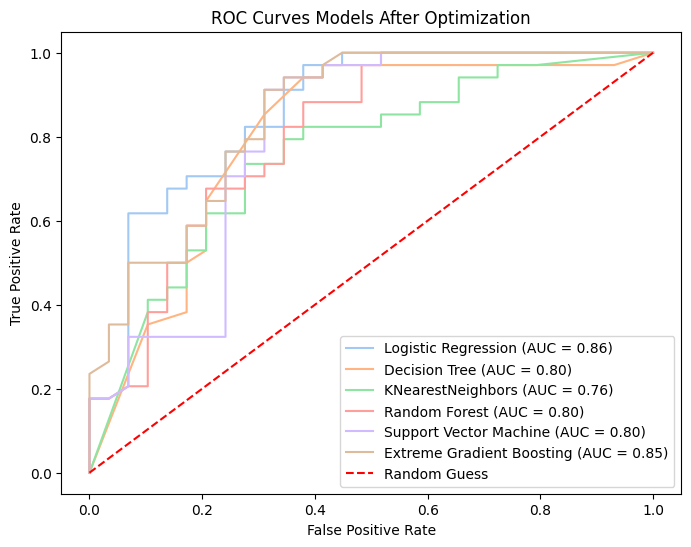 Figure 4: The ROC curve shows the performance of each model
Ensemble Strategy
To improve overall robustness, a Voting Classifier was implemented to aggregate predictions from all six optimized models.
Two strategies were tested:
| Strategy | How It Works | Accuracy |
|---|---|---|
| Hard Voting | Majority class label wins | 73% |
| Soft Voting | Average predicted probabilities, highest wins | 76% |
Soft voting proved superior as it factors in the prediction confidence of each individual model rather than relying solely on binary outputs.
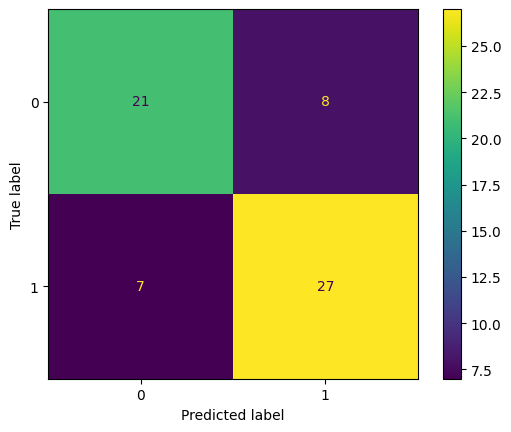 Figure 5: The confusion matrix shows a performance evaluation, comparing the original data and the predicted results
Results & Key Findings
- Best single model: Logistic Regression and XGBoost (highest AUC after tuning)
- Best ensemble: Soft Voting Classifier at 76% accuracy
- Most impactful features: Chest pain type (
cp) and maximum heart rate (thalach) showed the strongest correlation with the target - Main challenge: Overfitting was observed across most models, attributed to the relatively small sample size (~1,000 records) after cleaning
Limitations & Future Work
While the ensemble model achieved reasonable accuracy, several limitations provide opportunities for future iteration:
- Sample Size: The relatively small dataset (~1,000 records) contributed to persistent overfitting in some models despite tuning.
- Feature Constraint: Limiting the model to only four features may have excluded useful secondary signals.
Future improvements could involve retraining the models with the full 13-feature set, securing a larger dataset to mitigate overfitting, and implementing SHAP values to provide necessary clinical explainability for the model’s predictions.
Tools & Libraries
Python · pandas · NumPy · scikit-learn · XGBoost · imbalanced-learn (SMOTE) · Matplotlib · Seaborn