Dynamic Donor Status Migration Analysis
Engineered a computationally heavy DAX-driven dashboard to track state transitions across 18,400+ donors, enabling dynamic YoY, YtD, and WoW migration analysis.
Overview
Understanding donor churn requires more than looking at static retention rates. It requires mapping the exact pathways donors take as their engagement levels change over time.
This project tracks the complete migration of over 18,400 donors across four primary states. These states are Active (Aktif), Not Yet Active (Belum Aktif), Inactive (Tidak Aktif), and Blank/New (Kosong). The dashboard allows organizational leadership to pinpoint exactly where donor drop-off occurs and where acquisition efforts are landing.
Technical Implementation and Performance Trade-offs
The core requirement was to make the migration analysis fully dynamic across different time intelligence frameworks. Users needed to filter transitions seamlessly between Year-over-Year, Year-to-Date, and Week-over-Week views.
To achieve this, I engineered complex DAX measures that calculate both the “Current Period Status” and “Previous Period Status” on the fly based on the user’s slicer selection. The measure evaluates the intersection of these two temporal states to categorize the exact transition path.
This architectural decision prioritizes analytical flexibility over rendering speed. Because the DAX engine must perform row-by-row context transitions for the entire database simultaneously, the matrix calculations are computationally heavy. The dashboard experiences a rendering latency of up to 5 seconds when switching major time periods. This is an accepted trade-off to avoid hardcoding hundreds of temporal variations into the data model.
Macro Tracking with Year-over-Year (YoY) Migration
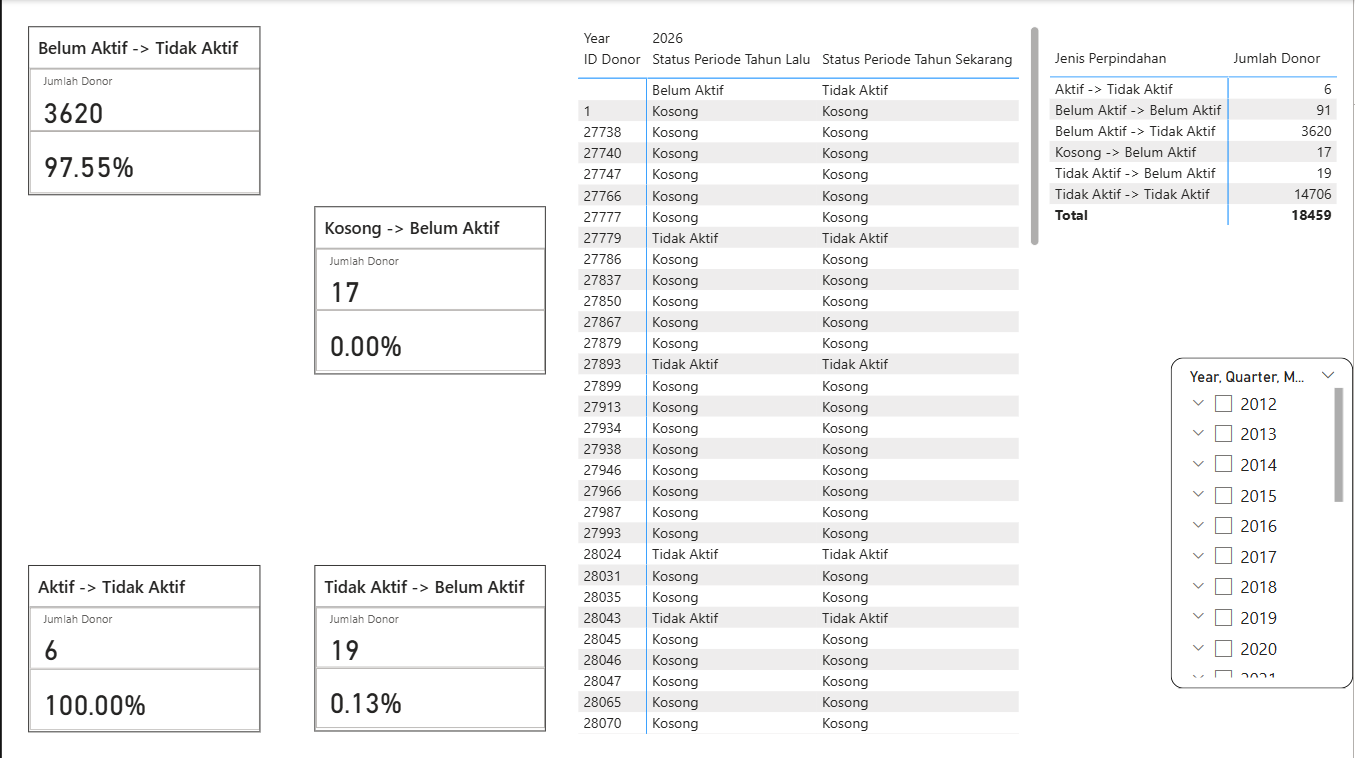 The Year-over-Year (YoY) migration matrix highlighting macro trends, with 3,620 donors degrading to the Inactive state.
The Year-over-Year view evaluates the macro-level health of the donor base by comparing full annual periods. The data exposes severe long-term churn. Specifically, 3,620 donors moved from Belum Aktif directly into the Tidak Aktif status. This 97.55% degradation within that pathway serves as a critical alert for the retention team, highlighting a systemic failure to warm up previously acquired but uncommitted donors over a 12-month span.
Pacing Assessment with Year-to-Date (YtD) Migration
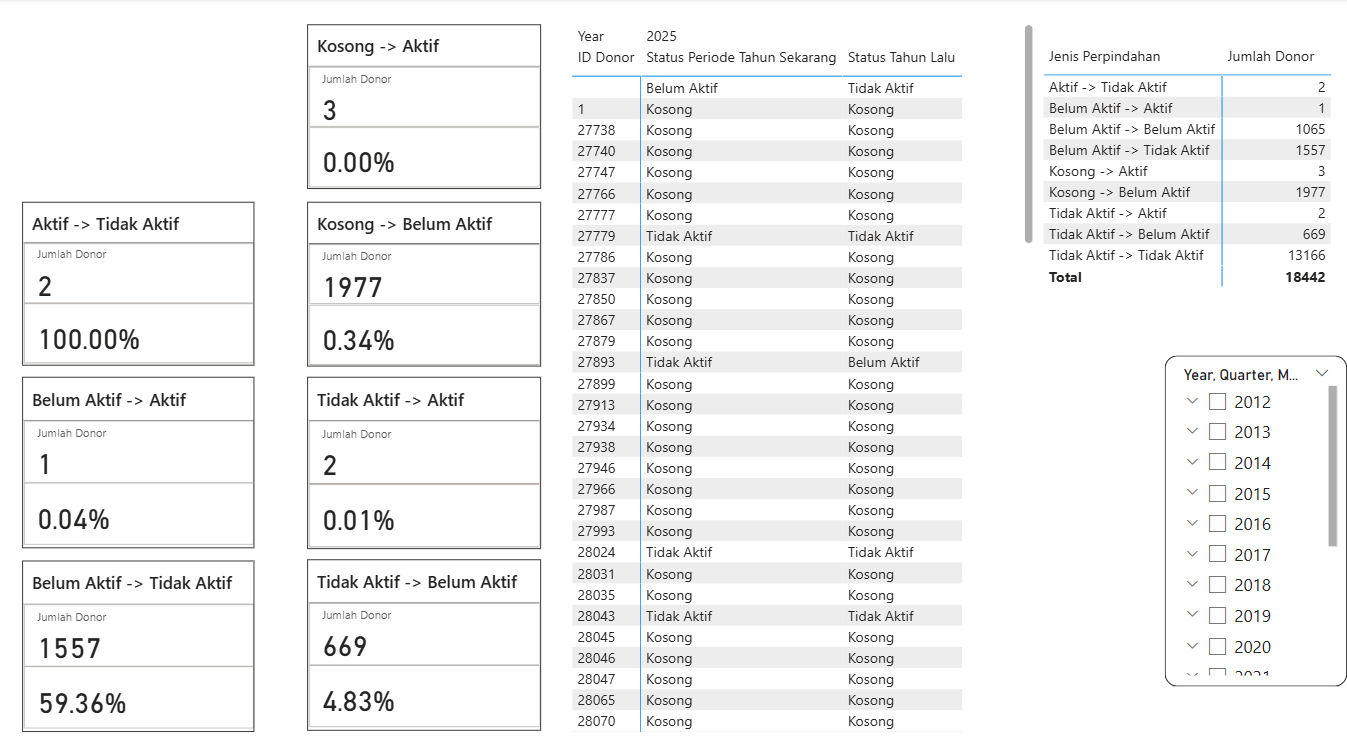 The Year-to-Date (YtD) migration matrix tracking current year progress against the same period last year.
The Year-to-Date view is essential for mid-year pacing and performance assessments. It compares current progress against the exact same period in the previous year. This view reveals substantial top-of-funnel movement. A large cohort of 1,977 previously unrecorded records shifted into the Belum Aktif phase. Concurrently, 1,557 donors degraded from Belum Aktif to Tidak Aktif. This dynamic indicates that while acquisition channels are actively bringing in new data, the short-term conversion pipeline remains a bottleneck.
Tactical Monitoring with Week-over-Week (WoW) Migration
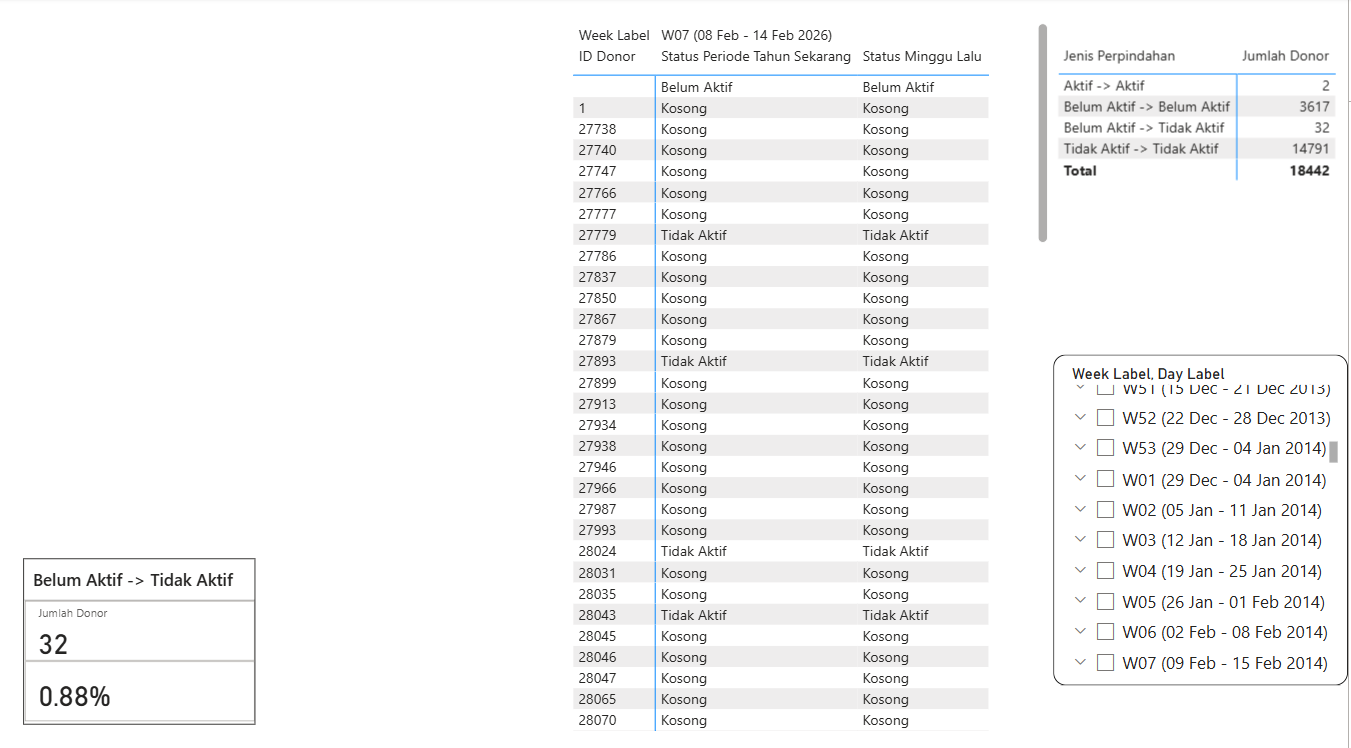 Week-over-Week (WoW) transition tracking capturing micro-movements in the donor base.
Because the transition logic relies on dynamic measures, the exact same DAX architecture scales down to weekly analysis without requiring a separate data model.
The Week-over-Week view allows campaign managers to track immediate fallout or recovery following specific email blasts or emergency appeals. For instance, during a specific 7-day window, the dashboard captured a micro-movement of 32 donors dropping to the inactive state. This granularity is essential for evaluating the immediate impact of short-term marketing interventions and adjusting communication strategies on the fly.
Tools & Skills Demonstrated
Power BI · DAX · Dynamic Time Intelligence (YoY, YtD, WoW)