International Donor Segmentation & Analysis
Developed a comprehensive Power BI dashboard integrating BigQuery and SharePoint data to analyze international donor behavior, RFM segmentation, and global branch performance across five regions.
Overview
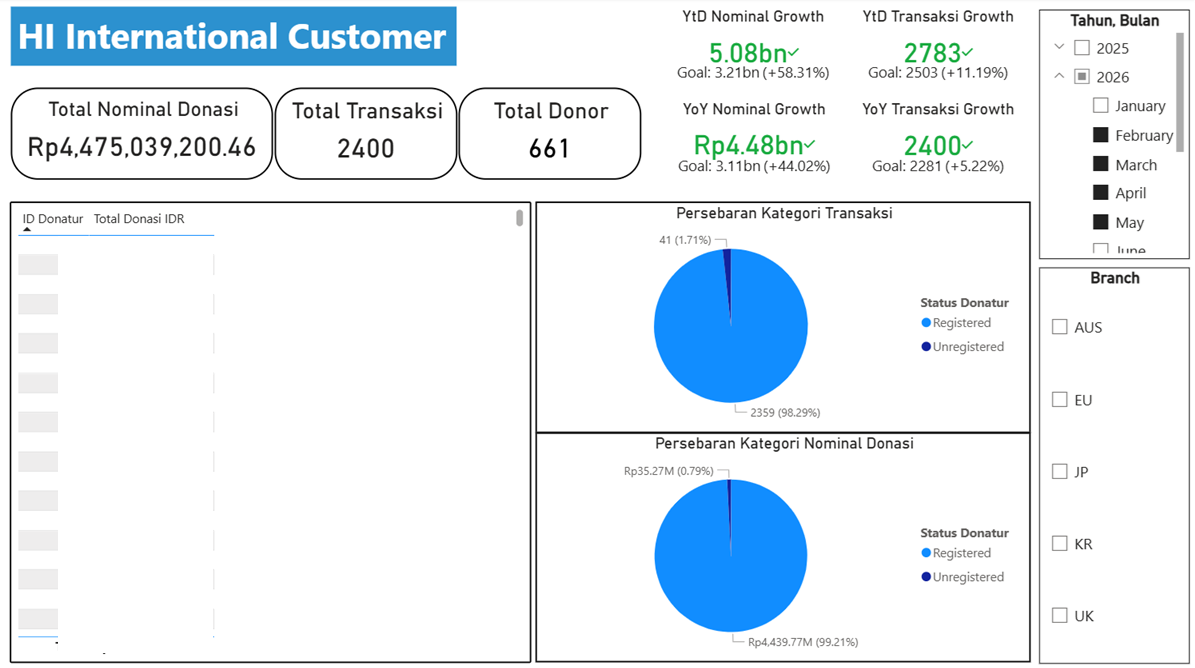
Managing international philanthropic contributions requires consolidating data across multiple currencies, regions, and campaigns. During my internship at Human Initiative, I developed an analytics dashboard to track international donor behavior across five global branches (Australia, EU, Japan, South Korea, and the United Kingdom).
The primary objective was to move beyond basic revenue tracking and implement advanced donor segmentation (RFM) to understand retention, churn, and campaign effectiveness on a global scale.
Data Architecture & Integration
The data pipeline for this project utilized a hybrid approach, connecting live organizational data from SharePoint (Excel Online) with historical and structural datasets stored in Google BigQuery.
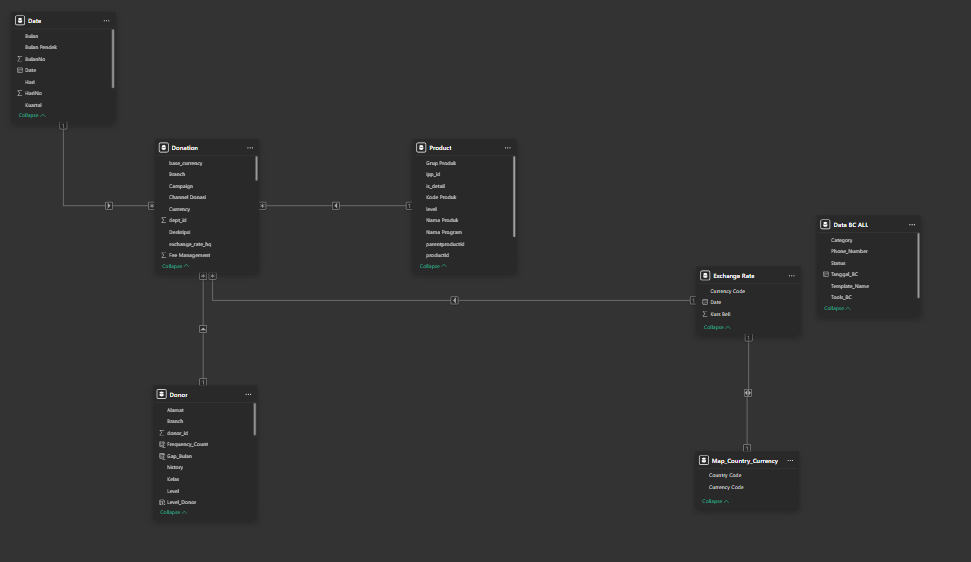 The relational data model connecting Donation fact tables with dimension tables for Products, Donors, Dates, and Exchange Rates.
To accurately map regional branch performance, I encountered formatting discrepancies between the spatial geographic files and the organizational Excel data. I resolved this by manually processing the geographic coordinate files using Mapshaper, adjusting the topological data to perfectly align with the branch naming conventions in the SharePoint dataset.
RFM Segmentation & Donor Journey
A core component of the analysis was implementing an RFM (Recency, Frequency, Monetary) segmentation model to categorize the 2,804 international donors into actionable groups.
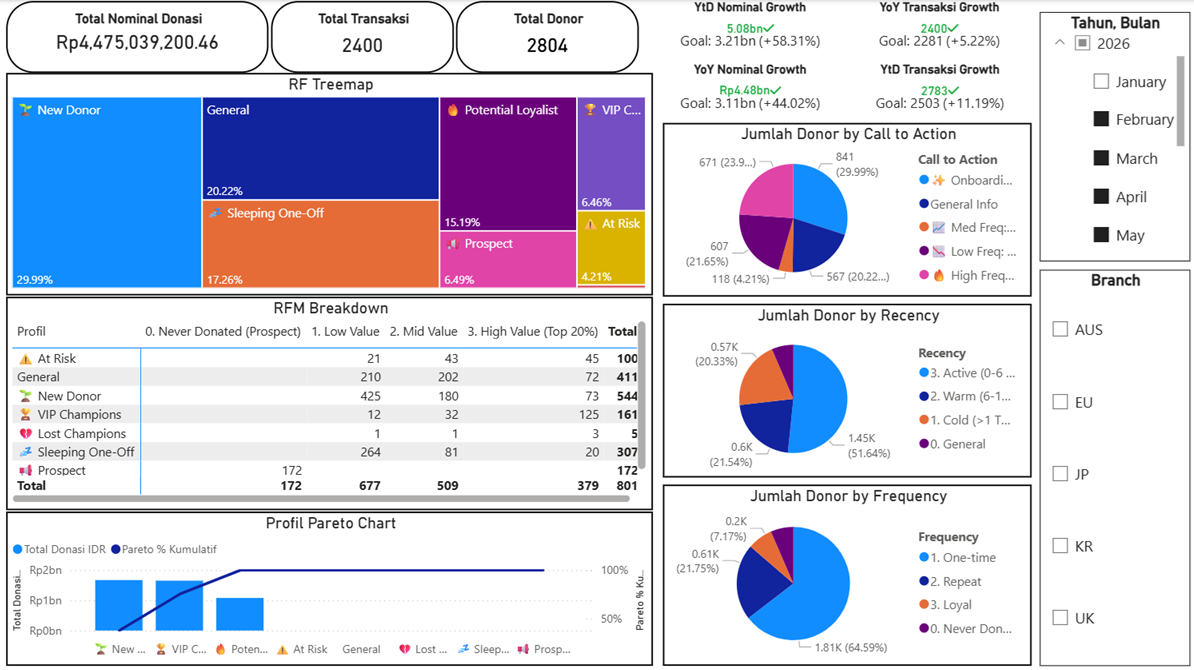 RFM Treemap visualizing donor segments such as New Donors, Potential Loyalists, and VIP Champions alongside a Pareto cumulative chart.
The RFM treemap reveals that “New Donors” form the largest single block (nearly 30%), followed closely by “General” and “Sleeping One-Off” donors. The accompanying Pareto chart visually confirms that a very small percentage of top-tier donors (VIP Champions) contribute the vast majority of total revenue.
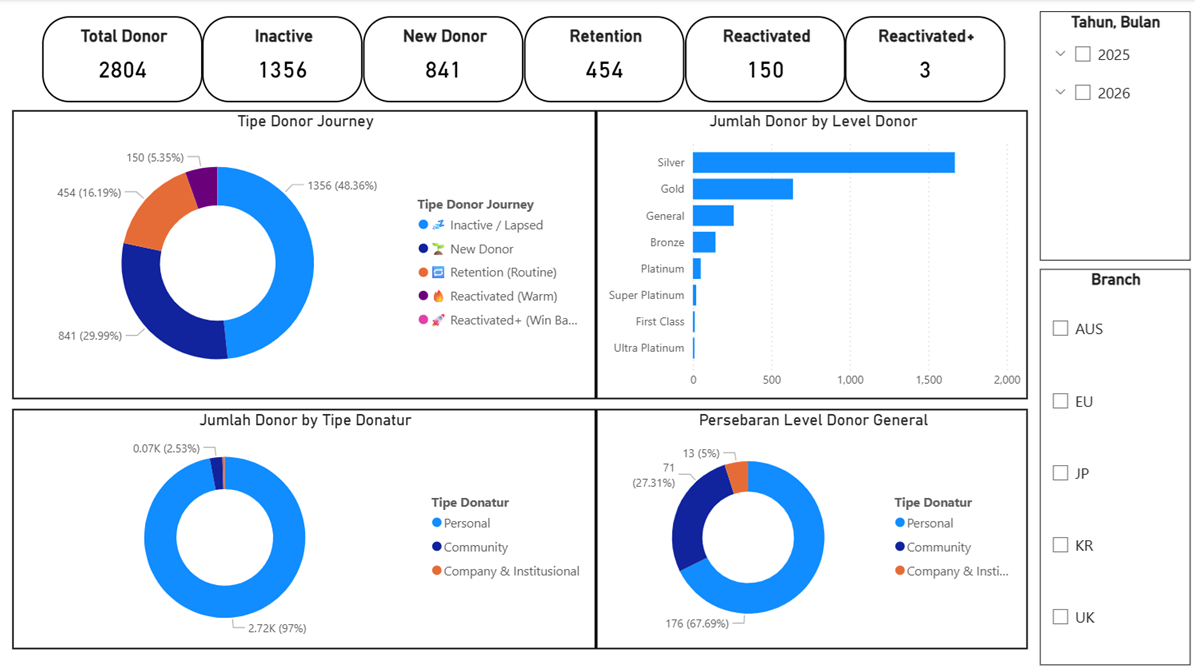 Donor Journey dashboard tracking retention metrics and loyalty tier distribution.
The tracking system categorizes the donor base into distinct journey phases. The data highlights a high volume of inactive or lapsed donors (1,356) compared to retained routines (454). This clearly identifies reactivation campaigns as a primary area for strategic improvement.
Temporal Analysis & Giving Patterns
Analyzing donation timestamps uncovered highly predictable behavioral patterns.
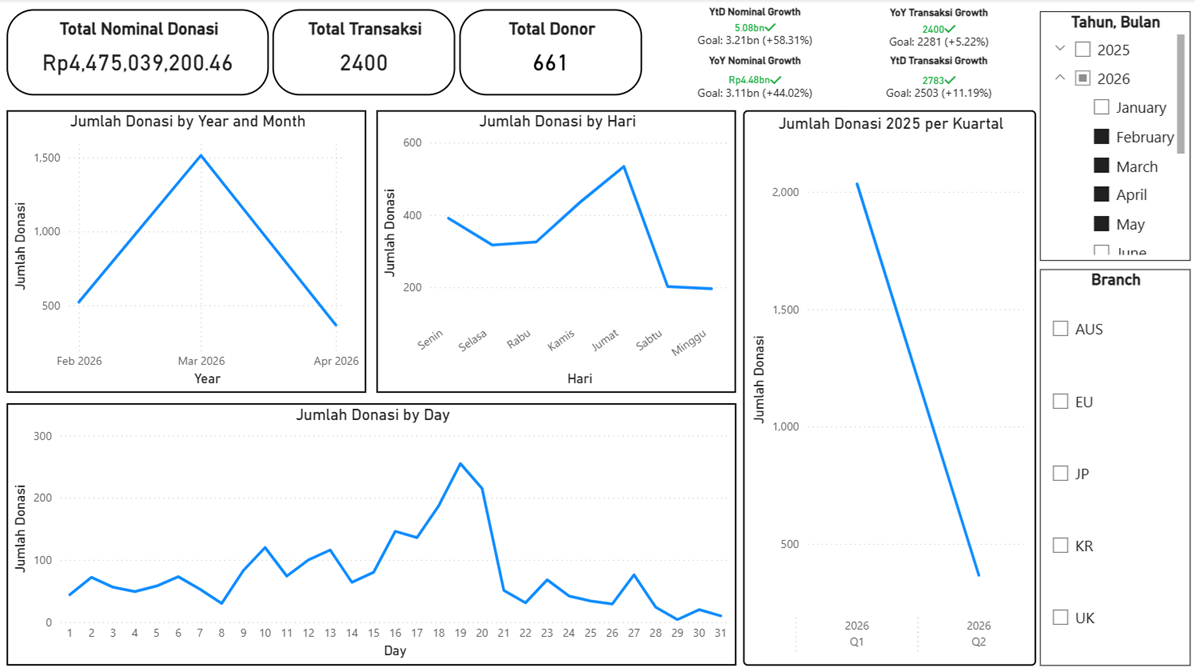 Time-series analysis tracking transaction volume across months, days of the week, and specific dates within the month.
The temporal line charts reveal three key insights. First, monthly tracking shows a massive spike in March 2026, correlating with seasonal campaign pushes. Second, weekly data indicates that donations consistently peak on Fridays (Jumat), aligning with cultural and religious giving habits. Finally, granular daily tracking indicates distinct mid-month spikes around the 19th and 20th.
Geographic & Product Performance
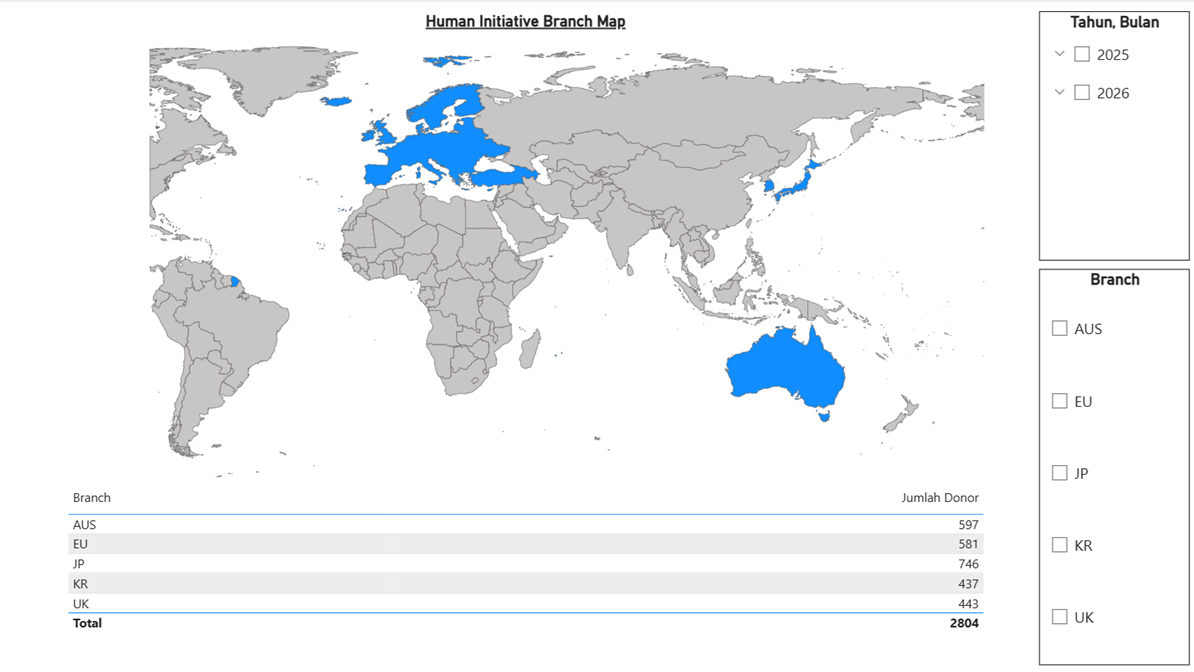 Custom map visualization built using Mapshaper-adjusted data to track donor volume across five international branches.
The geographic distribution shows a relatively balanced donor base across the five international branches. Japan leads in total donor volume, followed closely by Australia and the European Union. The custom map visual provides a quick reference for regional managers to assess their respective market penetration.
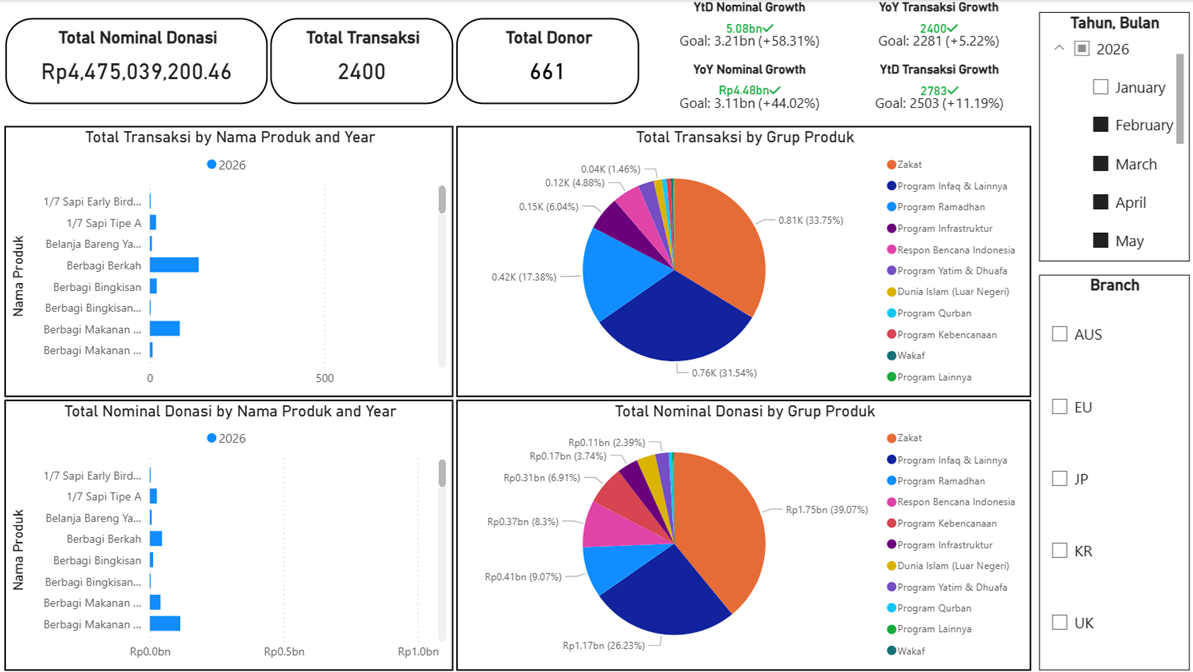 Revenue and transaction breakdown across product categories like Zakat, Qurban, and specific emergency response programs.
On the product side, the dashboard breaks down transactions by specific initiatives. General Zakat and distinct seasonal programs (such as Qurban and Ramadhan) account for the largest shares of the international funding portfolio.
Strategic Implications
- Prioritize VIP Retention: The Pareto distribution confirms that losing a single VIP Champion has a disproportionate impact on overall revenue. Dedicated relationship managers should be assigned to the “Potential Loyalist” and “VIP Champion” segments.
- Reactivation Focus: With over 48% of the tracked donor base marked as Inactive, the international branches need targeted “Win-Back” campaigns rather than focusing exclusively on new acquisitions.
- Currency and Exchange Standardization: By integrating an Exchange Rate dimension table, the dashboard successfully standardizes multiple foreign currencies into a single base currency, providing executive leadership with an accurate, real-time view of global financial performance.
Tools & Skills Demonstrated
Power BI · Power Query · Mapshaper · DAX · RFM Modeling · Geographic Data Transformation