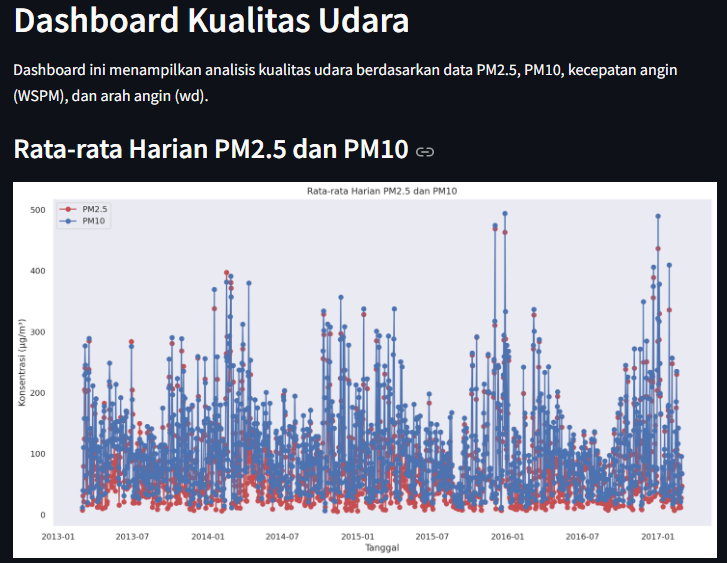
Beijing Air Quality Analysis
Analyzed 385,000+ hourly air quality readings across 11 Beijing monitoring stations (2013–2017) to uncover how location, season, and wind conditions drive PM2.5 and PM10 pollution levels.
Overview
Air pollution remains a critical public health challenge in rapidly urbanizing environments. While sensor networks provide extensive raw data, extracting actionable insights requires structured analysis.
This project explores a four-year air quality dataset from 11 monitoring stations across Beijing. The objective is to identify spatial pollution patterns, seasonal risk windows, and meteorological drivers to better inform urban planning and public health interventions.
Core Research Questions:
- Which monitoring stations record the highest sustained pollution levels?
- How do seasonal and monthly patterns impact air quality?
- What role do wind speed and direction play in pollutant accumulation and dispersal?
Dataset & Preprocessing
The analysis utilized the PRSA Air Quality Dataset (Beijing), covering hourly readings from March 2013 to February 2017.
- Scale: 11 stations × 35,064 hourly records (385,704 total rows after merging)
- Key Pollutants: PM2.5 (fine particulate matter) and PM10 (coarse particulate matter)
- Meteorological Variables: Temperature, pressure, dew point, rainfall, wind speed, wind direction
Prior to analysis, the 11 individual station datasets required a uniform preprocessing pipeline. Temporal columns (year, month, day, hour) were consolidated into a single datetime index.
Missing sensor readings were handled systematically. Because time-series environmental data changes gradually, linear interpolation was applied to estimate missing values based on neighboring hourly trends. Residual edge cases were resolved using forward and backward filling. Finally, the cleaned datasets were labeled and concatenated into a unified dataframe containing zero missing values.
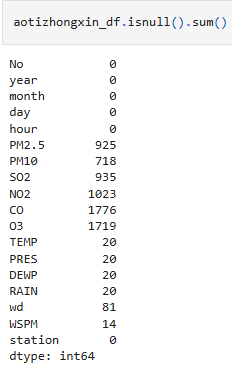 Missing value counts per column before imputation (Aotizhongxin station). Linear interpolation was the primary strategy used to preserve hourly trends.
Spatial Analysis (Station Comparison)
Average PM2.5 and PM10 concentrations were calculated for each station over the full four-year period.
| Rank | Station | Avg PM2.5 | Avg PM10 |
|---|---|---|---|
| 1 | Dongsi | 86.14 | 110.35 |
| 2 | Nongzhanguan | 85.08 | 109.38 |
| 3 | Wanshouxigong | 85.07 | 112.51 |
| 11 | Dingling | 66.85 | 84.11 |
A clear spatial disparity exists within the city. The most polluted stations (Dongsi, Nongzhanguan, Wanshouxigong) are located in densely populated urban core districts characterized by high vehicle traffic and commercial activity.
Conversely, the cleanest stations like Dingling (which recorded a 29% lower PM2.5 average than Dongsi) are situated in outer suburban or rural areas where lower traffic density and higher vegetation cover act as natural pollution sinks.
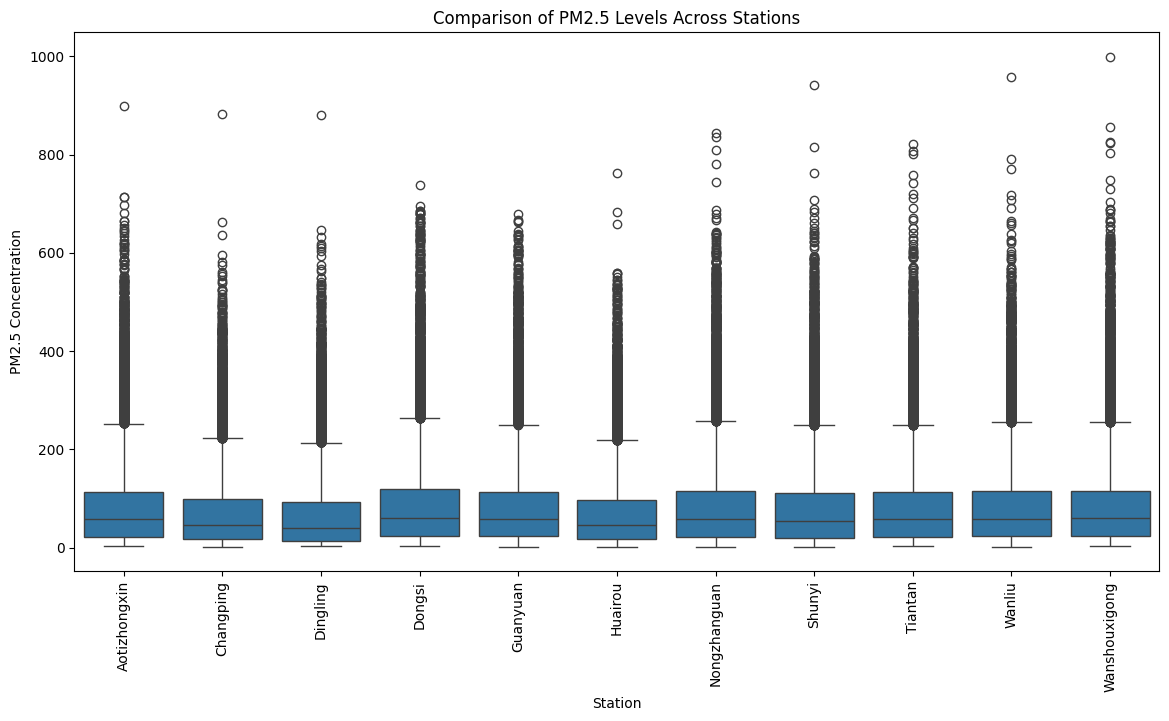 PM2.5 distribution across all stations. Urban core stations exhibit higher medians and heavier upper tails, indicating more frequent extreme pollution events compared to outer suburban stations.
Temporal Analysis (Seasonal & Monthly Trends)
Pollution levels display strong cyclical patterns when aggregated by month and season.
| Season | Avg PM2.5 | Avg PM10 | Primary Driver |
|---|---|---|---|
| Winter | 95.25 | 113.96 | Coal heating, inversions |
| Fall | 81.65 | 102.13 | Stagnant air |
| Spring | 76.83 | 119.09 | Dust storms |
| Summer | 64.40 | 79.41 | Rainfall washout |
The data reveals a distinct seasonal U-curve. Pollution peaks during winter, particularly in December and January. This is driven by increased fossil fuel consumption for residential heating combined with cold thermal inversions that trap particulate matter near the surface.
August is consistently the cleanest month, as summer convective rainfall physically washes aerosols from the atmosphere. A notable anomaly occurs in Spring; March records the highest PM10 levels of the year despite moderate PM2.5, a signature characteristic of dust and sandstorms blowing in from northern deserts.
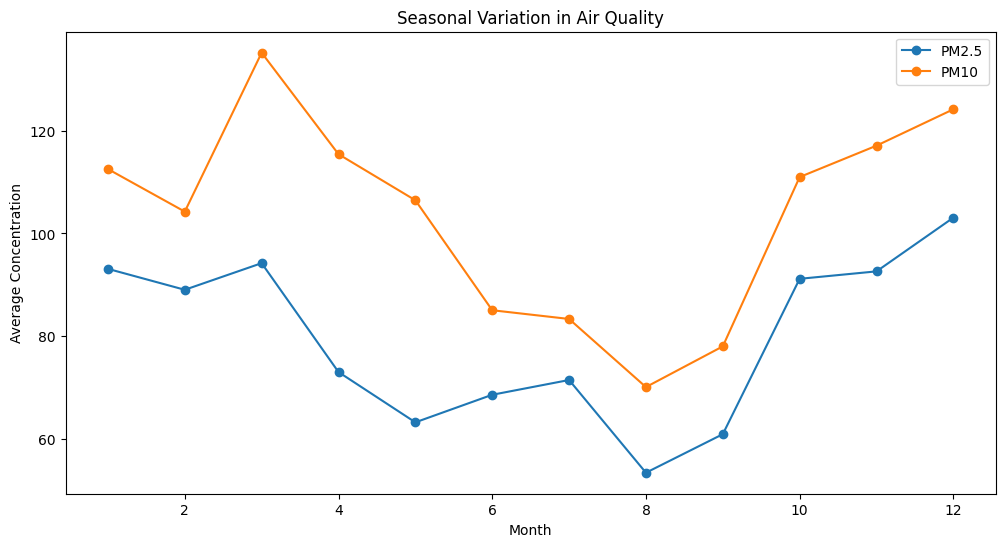 Monthly average pollution levels follow a seasonal curve, peaking in winter and reaching their lowest point in summer. The March PM10 anomaly reflects spring dust storm activity.
Meteorological Drivers (Wind Dynamics)
Wind acts as a primary mechanical regulator of air quality, analyzed here across speed and direction.
Wind Direction Analysis:
- Northwest (NW) Winds: Average PM2.5 of 50.04. These are the cleanest air masses, originating from less-populated continental areas.
- East/Southeast (E, ESE) Winds: Average PM2.5 exceeds 102.00. These winds track across heavily industrialized corridors and the urban fabric itself, carrying accumulated pollutants into the monitoring zones.
Wind Speed Analysis: Higher wind speeds correspond directly with lower particulate concentrations. On calm days with near-zero wind speed, the average PM2.5 frequently surpasses 105 µg/m³, which is more than double the overall station baseline. Atmospheric ventilation is critical for dispersal; stagnant air presents a high pollution risk regardless of the season.
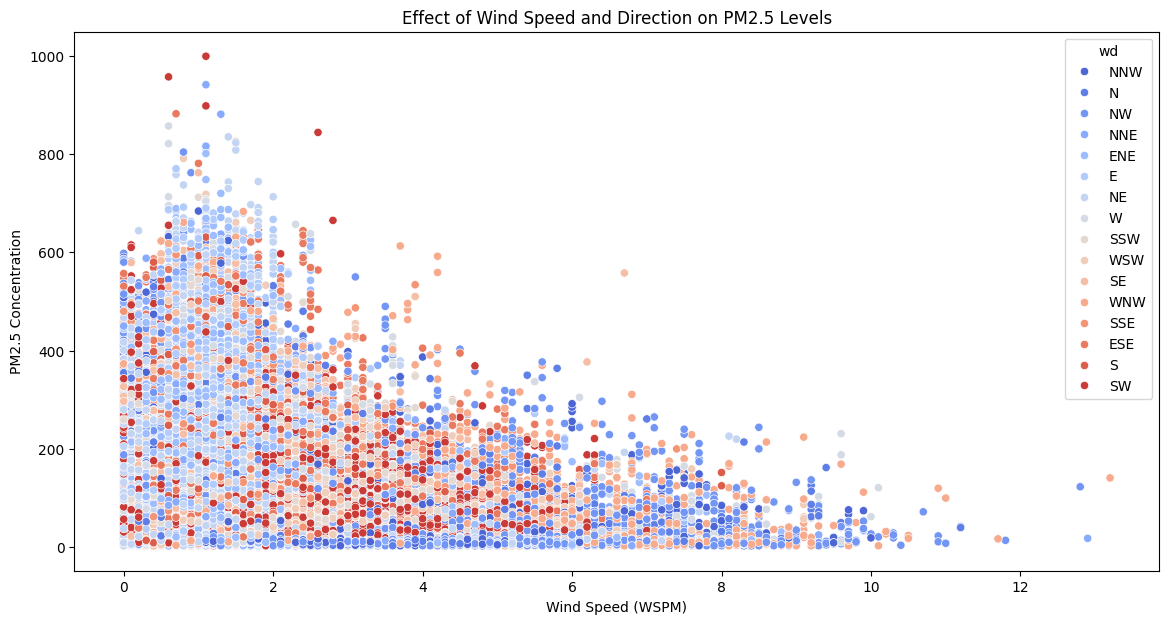 Wind speed versus PM2.5, color-coded by direction. Increased wind speed effectively disperses pollutants. Easterly winds (warmer colors) consistently associate with higher PM2.5 concentrations compared to northwesterly winds (cooler colors).
Conclusion
This analysis provides three distinct insights for urban environmental management:
- Spatial Inequity: Urban core districts (e.g., Dongsi, Nongzhanguan) bear a significantly higher pollution burden. Targeted local interventions, such as traffic restrictions and localized emission controls, will yield the highest marginal public health benefits in these specific zones.
- Seasonal Interventions: The winter months (November to January) represent the critical risk window for fine particulate matter due to heating demands and thermal inversions. Policies should prioritize district heating efficiency and strict coal use reduction during this specific period.
- Urban Ventilation: Wind speed and direction dictate pollution accumulation. Northwest winds cleanse the air, while easterly winds import industrial pollution. This data supports wind-aware urban planning, suggesting that building orientation and the preservation of urban ventilation corridors can actively improve natural air exchange in high-density areas.
Tools & Libraries
Python · pandas · NumPy · Matplotlib · Seaborn