Indonesian Bank Stock Volatility & Time Series Forecasting
Analyzed financial health and stock behavior of Indonesia's top 4 banks across the COVID-19 period, building 12 Prophet models to forecast stock prices with MAPE as low as 1.75%.
This was a team project developed for the Data Science & Artificial Intelligence course by Startup Campus, where I served as a Team Leader. Disclaimer: The forecasting results are for educational purposes only, do not reflect guaranteed future values, and should not be used as actual financial recommendations.
Overview
The COVID-19 pandemic subjected Indonesia’s financial sector to an unprecedented stress test, driving lasting shifts in bank liquidity, profitability, and stock volatility. For institutional investors, understanding these stress behaviors and predicting recovery trajectories is essential for robust risk management.
This project evaluates the financial health and market dynamics of four major Indonesian banks (anonymized as Banks A, B, C, and D) throughout the pandemic and into the recovery phase. Following this fundamental analysis, we developed 12 Prophet time-series models to forecast 1-year stock prices and trading volumes, generating data-driven quantitative signals to support investment strategies.
Data & Preprocessing Pipeline
The analysis utilized 12 datasets covering quarterly Balance Sheets, Income Statements, and daily Stock Prices from 2018 to 2024.
To prepare the data for modeling, a consistent preprocessing pipeline was applied across all banks:
- Transposed wide-format financial statements into chronological time-series data.
- Handled missing values dynamically: nulls in feature calculation paths were imputed with zeros to preserve ratio denominators, while non-essential missing data was left blank to prevent artificial skew.
- Standardized all target variables using
StandardScalerto ensure fair cross-bank modeling and evaluation.
Financial Health Analysis (COVID vs. Post-Pandemic)
We engineered three key financial indicators—Debt-to-Equity Ratio (DER), Current Ratio, and Net Profit Margin (NPM)—treating the 2020–2021 period as a natural stress test.
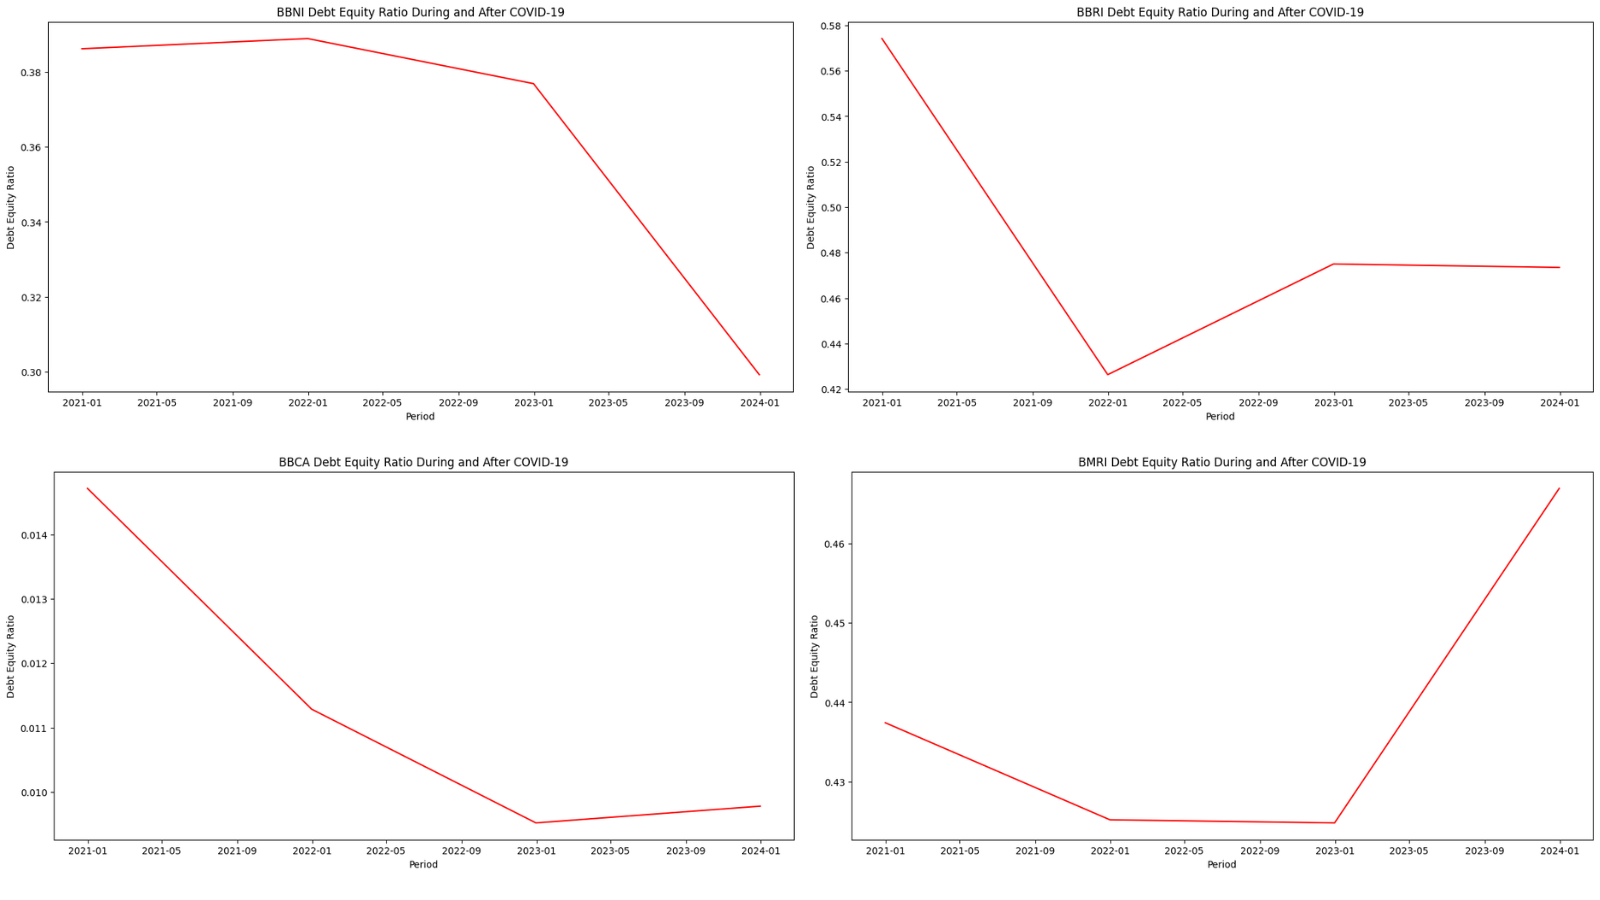 Debt-to-Equity Ratio trends. COVID-era peaks are visible across all tickers, with Bank D showing a dramatic post-2022 spike.
Key Fundamental Insights:
- Liquidity Hoarding: Bank A showed an anomalous spike in its Current Ratio during the 2020 crash. Rather than financial inefficiency, this reflected a deliberate cash-hoarding strategy to buffer against loan defaults, which successfully unwound post-pandemic.
- Leverage Divergence: Post-2021, Bank A and Bank C actively deleveraged. In contrast, Bank D’s DER spiked significantly through late 2023, signaling aggressive credit expansion and higher leverage risk.
- Profitability: While most banks experienced sustained margin compression due to elevated provisioning, Bank D was the outlier, consistently expanding its Net Profit Margin from 2021 to 2023.
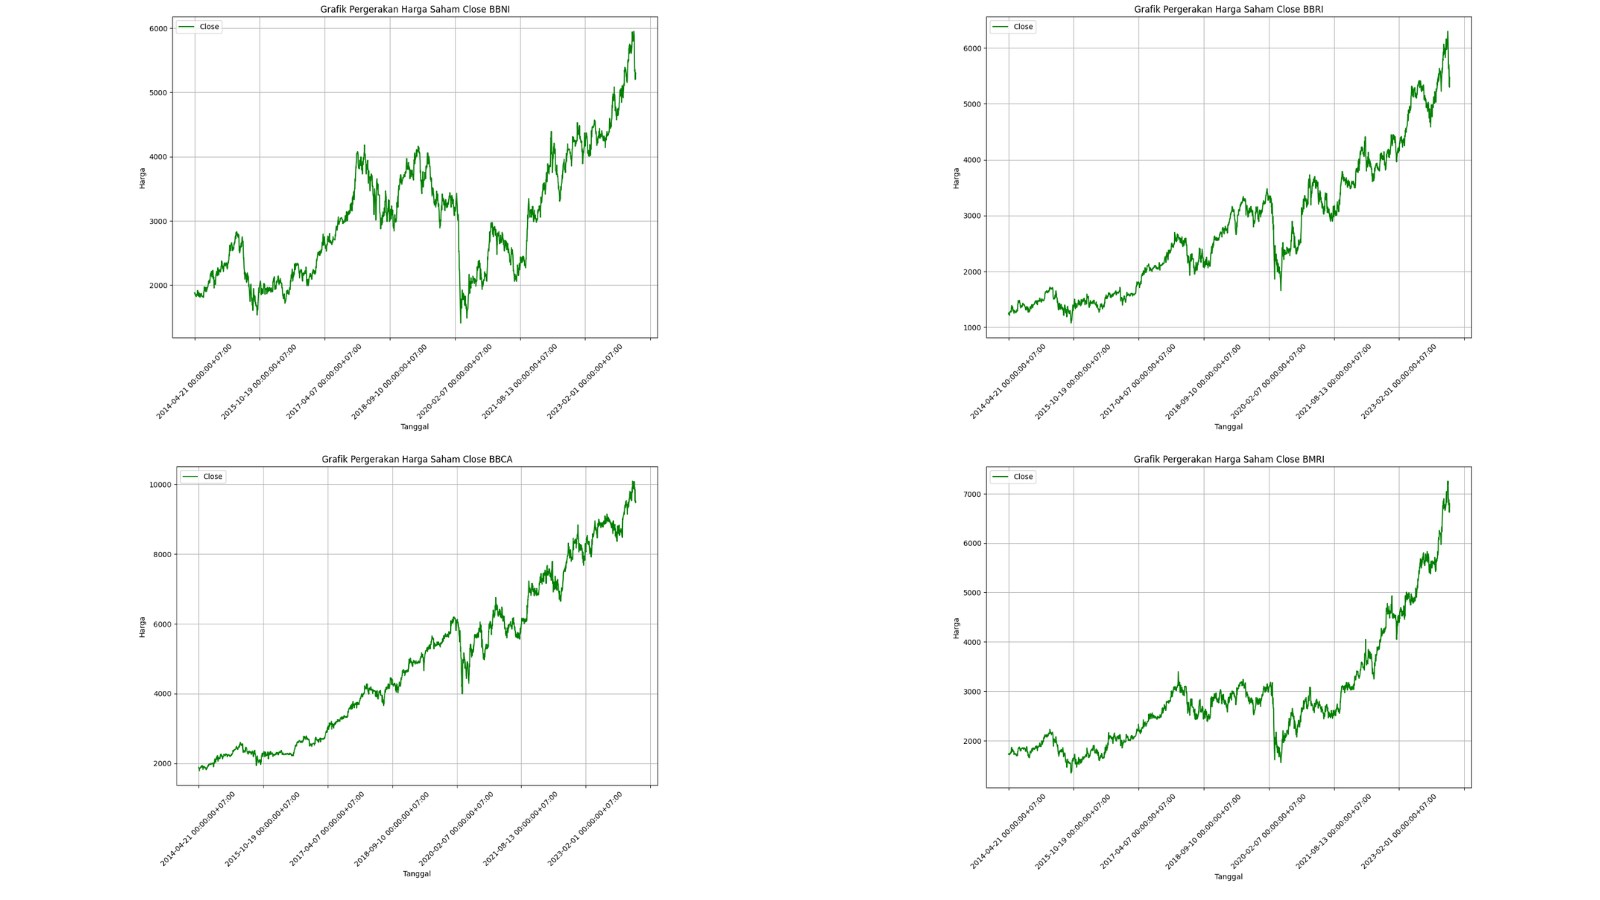 The 2020 market shock triggered a synchronized drawdown, but recovery trajectories were asymmetric, with Bank C and Bank D leading the price recovery.
Time Series Forecasting with Prophet
To predict future market behavior, Meta’s Prophet was utilized due to its robustness against missing data and ability to handle multiple seasonalities alongside holiday effects.
We trained 12 distinct models targeting Close Price, Open Price, and Trading Volume for each bank. Indonesian public holidays were explicitly incorporated into the models to reflect the IDX trading calendar.
Hyperparameters (changepoint_prior_scale, seasonality_prior_scale) were optimized using a 5-fold time-series cross-validation approach with a 730-day initial training window, 180-day step size, and a 365-day forecast horizon.
Model Performance (Cross-Validation MAPE)
| Bank | Close Price | Open Price | Volume |
|---|---|---|---|
| Bank A | 4.29% | 7.21% | 6.22% |
| Bank B | 1.75% | 2.85% | 4.39% |
| Bank C | 2.52% | 7.39% | 4.72% |
| Bank D | 4.79% | 1.84% | 3.59% |
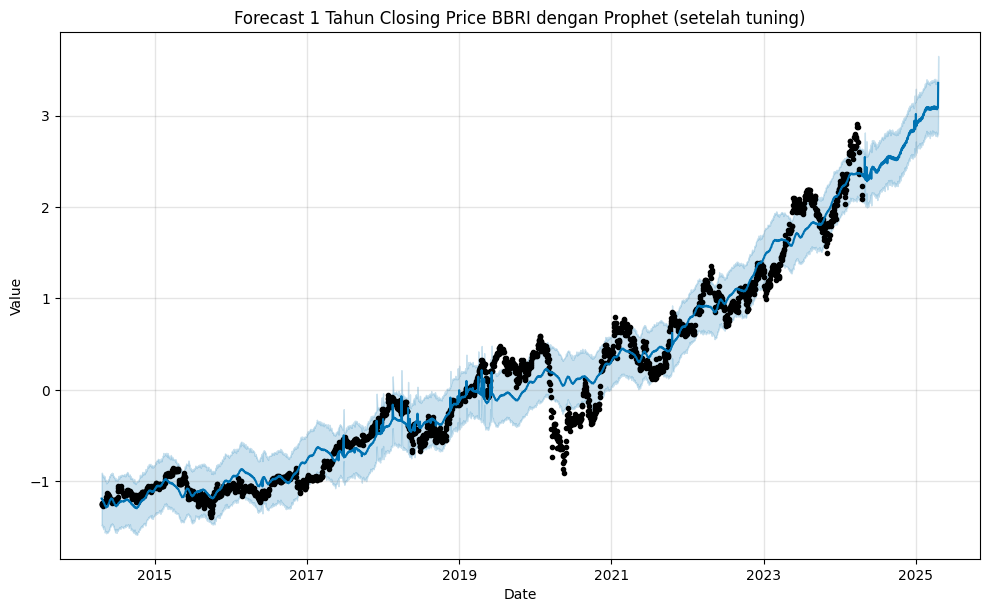 1-year forecast for Bank B closing price post-tuning. The model captures the underlying upward trend while accounting for weekly market seasonality.
Forecasting Takeaways:
- Bank B Close Price achieved the highest accuracy with a Mean Absolute Percentage Error (MAPE) of just 1.75% over a 365-day horizon.
- Almost all optimized models converged on a low
changepoint_prior_scale(0.01), indicating that despite the pandemic shock, the underlying long-term structural trends of these mega-cap banks remain highly stable. - As expected, volume forecasts carried higher error rates across the board, reflecting the event-driven, spiky nature of institutional trading blocks.
Investment Synthesis
Combining fundamental realities with quantitative forecasts yields distinct profiles for each asset:
- Bank B: The most quantitatively stable investment—boasting the lowest price forecast error, an improving post-COVID trajectory, and manageable leverage.
- Bank D: High growth potential but elevated risk. It shows the strongest earnings recovery, but its sharply rising DER warrants careful monitoring.
- Bank C: The definitive low-volatility option. Highly stable DER and consistent trends make it the defensive anchor of the group.
- Bank A: Showed improving financial structure (declining DER) but stock forecasts carried higher uncertainty, suggesting price discovery is still ongoing.
Limitations & Future Work
- Univariate Constraints: Prophet models these time series in isolation. Future iterations should incorporate macroeconomic exogenous regressors (e.g., USD/IDR exchange rates, BI 7-Day Reverse Repo Rate) to capture systemic shocks.
- Volume Prediction: Time-series models struggle with volatile trading volumes. Experimenting with LSTM or Transformer-based architectures could better capture non-linear, sentiment-driven market activities.
- Risk Quantification: The current forecast intervals could be mathematically translated into Value at Risk (VaR) metrics to provide concrete downside parameters for portfolio allocation.
Tools & Libraries
Python · pandas · NumPy · Prophet · scikit-learn · statsmodels · Matplotlib · Seaborn · Google Colab